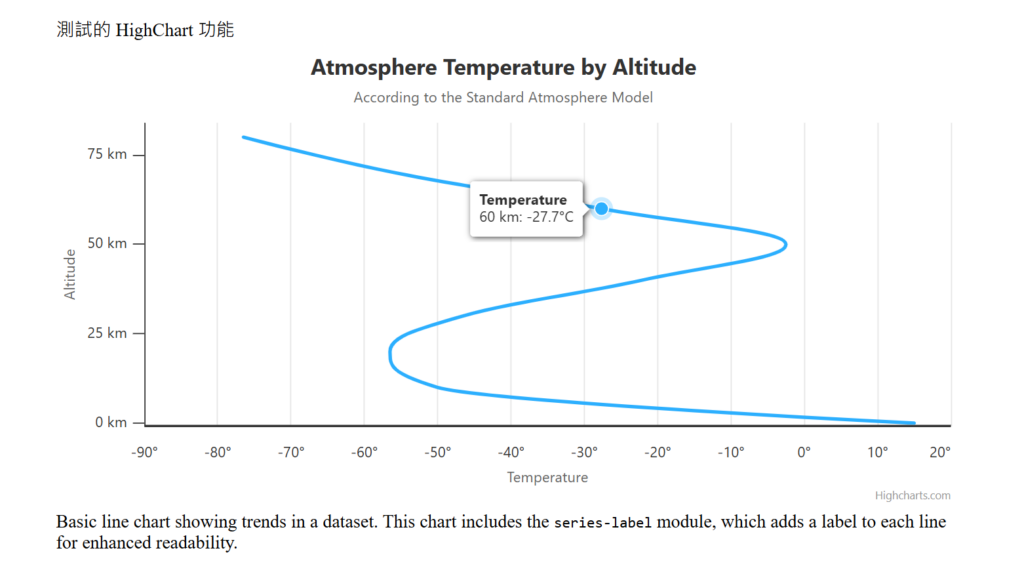
滑鼠點擊取消 與 點圖開關設定
<html>
    <head>
        <link rel="stylesheet" href="stlye.css">
    </head>
    <body>

        <figure class="highcharts-figure">
            <p class="highcharts-description">測試的 HighChart 功能</p>
            <div id="container"></div>
            <p class="highcharts-description">
                Basic line chart showing trends in a dataset. This chart includes the
                <code>series-label</code> module, which adds a label to each line for
                enhanced readability.
            </p>
        </figure>
    </body>
    <script src="https://code.highcharts.com/highcharts.js"></script>
    <script src="https://code.highcharts.com/modules/series-label.js"></script>
    <script src="https://code.highcharts.com/modules/exporting.js"></script>
    <script src="https://code.highcharts.com/modules/export-data.js"></script>
    <script src="https://code.highcharts.com/modules/accessibility.js"></script>
    <script src="index.js"></script>
</html>- series => marker 可以設定數據點
- series => enableMouseTracking 滑鼠移動上去是否有顯示視窗
Highcharts.chart('container', {
    chart: {
        type: 'spline',
        inverted: true
    },
    title: {
        text: 'Atmosphere Temperature by Altitude'
    },
    subtitle: {
        text: 'According to the Standard Atmosphere Model'
    },
    xAxis: {
        reversed: false,
        title: {
            enabled: true,
            text: 'Altitude'
        },
        labels: {
            format: '{value} km'
        },
        accessibility: {
            rangeDescription: 'Range: 0 to 80 km.'
        },
        maxPadding: 0.05,
        showLastLabel: true
    },
    yAxis: {
        title: {
            text: 'Temperature'
        },
        labels: {
            format: '{value}°'
        },
        accessibility: {
            rangeDescription: 'Range: -90°C to 20°C.'
        },
        lineWidth: 2
    },
    legend: {
        enabled: false
    },
    tooltip: {
        headerFormat: '<b>{series.name}</b><br/>',
        pointFormat: '{point.x} km: {point.y}°C'
    },
    plotOptions: {
        spline: {
            marker: {
                enable: false
            }
        }
    },
    series: [{
        name: 'Temperature',
        data: [
            [0, 15], [10, -50], [20, -56.5], [30, -46.5], [40, -22.1],
            [50, -2.5], [60, -27.7], [70, -55.7], [80, -76.5]
        ],
        marker: {
            enabled: false  // 隱藏數據點
        },
        enableMouseTracking: true  // 隱藏滑鼠追蹤功能
    }]
});
[…] 在 windows 裝好 docker file 以及有使用上一章建立好 […]